2026-27 El Niño Winter Forecast: What Snow & Ice Professionals Should Expect
NOAA puts the odds of a very strong El Niño above 90 percent for this winter. Here is what the forecast means for snowfall, temperatures and operations in every major US region.
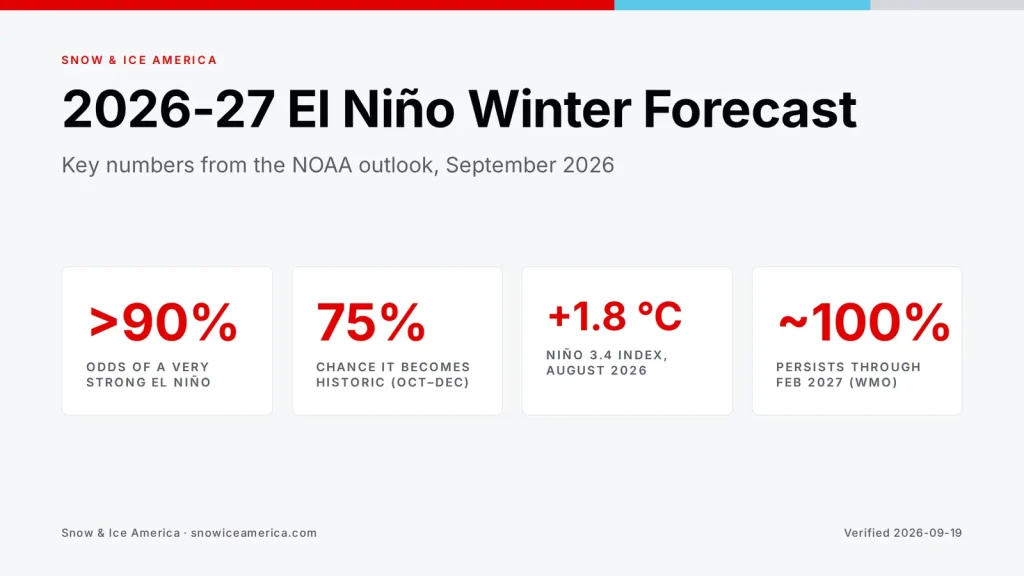
NOAA‘s September 2026 El Niño winter forecast 2026-27 gives a very strong event above 90 percent probability, with a 75 percent chance it becomes historic. Snowfall shifts south and west, the northern tier warms, and contractors in every region face a different operating picture this winter.
What NOAA Is Forecasting Right Now
The Climate Prediction Center’s September 10 diagnostic discussion confirms El Niño Advisory status with the Niño 3.4 index at +1.8 °C as of August 2026. Weekly values in late July through mid-August ran between +2.2 °C and +2.6 °C above average. Subsurface ocean temperatures are even more extreme — anomalies exceed +8 °C at depth, and the subsurface Kelvin wave driving this event peaked near +9 °C in the top 250 meters.
NOAA puts the probability of a very strong El Niño during fall and winter 2026-27 above 90 percent. The odds of a historic event — defined as a 3-month RONI value exceeding +2.5 °C — sit at 75 percent for October through December 2026. The WMO’s September update went further, calling the likelihood of persistence through February 2027 “approximately 100 percent” and noting this is the first time the organization has been that unequivocal in an El Niño/La Niña Update.
Peak intensity is expected from late fall through mid-winter 2026-27.
How Strong This El Niño Could Become
The three strongest El Niño events on modern record are 1982-83, 1997-98 and 2015-16. The current event may surpass all three. The European Centre for Medium-Range Weather Forecasts (ECMWF) August 2026 ensemble projects Niño 3.4 anomalies peaking between +3.5 °C and +4.5 °C by late fall, with a median autumn peak near +3.0 °C. If verified at the upper end, this would be the strongest El Niño since at least 1950.
That said, strength does not guarantee uniform impact. The 2015-16 super El Niño underperformed regional expectations in several areas — Southern California, for example, saw record coastal erosion but received less precipitation than analog years suggested. The 1997-98 event produced roughly $550 million in California flood damage. Analogs are guides, not guarantees.
What El Niño Actually Changes for Winter Operations
El Niño shifts the Pacific jet stream south. That single change cascades through nearly every regional forecast:
- Active southern storm track. The jet carries moisture-laden systems across the southern tier of the US, from California through the Gulf states.
- Suppressed Arctic air outbreaks. The northern tier sees fewer sustained cold-air intrusions, reducing both the frequency and duration of below-zero events.
- Reduced lake-effect snow. Warmer air crossing the Great Lakes means a smaller temperature contrast between the atmosphere and the lake surface — the mechanism that drives lake-effect bands.
- More atmospheric rivers on the West Coast. These narrow corridors of subtropical moisture hit the Sierra Nevada and Cascades more often during El Niño winters.
- Southward shift of the heaviest precipitation band. The dividing line between above-normal and below-normal precipitation runs roughly along the 40th parallel.
The net effect for snow and ice contractors is not a blanket “mild winter.” It is fewer plowable events in some regions and more intense, mixed-precipitation events in others.
Regional Forecast: Pacific Northwest
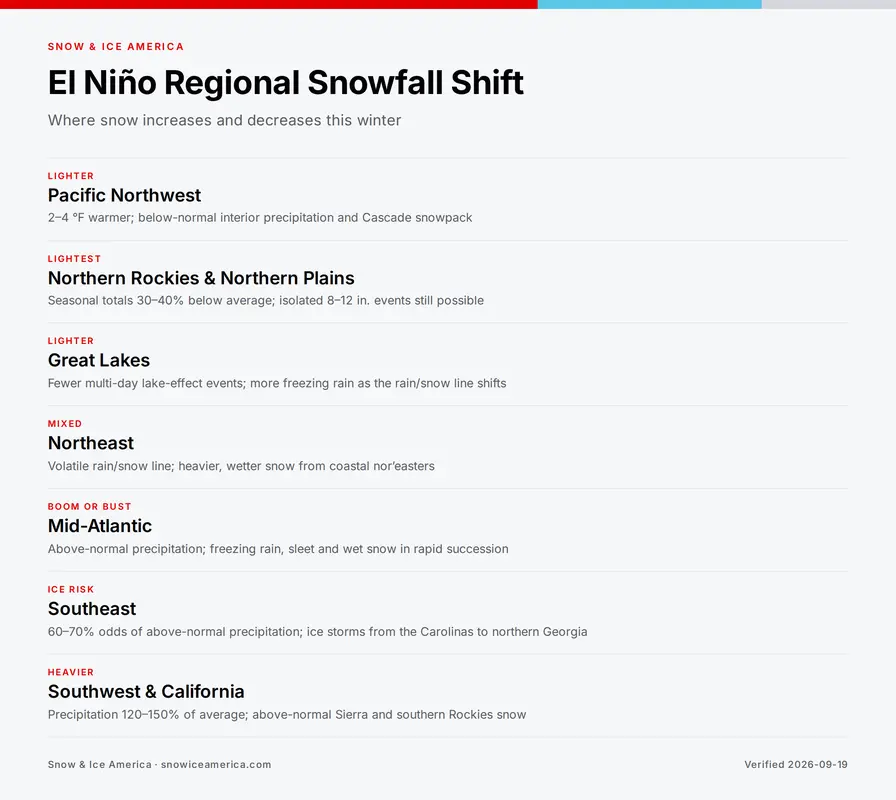
Temperature runs 2-4 °F above average, with NOAA giving above-normal temperatures about 70 percent probability across Oregon, Washington and Idaho. Interior precipitation trends below normal. Snowpack in the Cascades and northern interior ranges is expected to run below average.
What it means for operations. Fewer plowable events, particularly in the inland Northwest. Contractors on per-event pricing face revenue shortfall risk. Watch for late-season rain-on-snow flooding — a common El Niño pattern in the Northwest that creates ice management problems even when snow totals are low. The USDA Climate Hubs confirms this as the characteristic El Niño signature for the region.
Regional Forecast: Northern Rockies and Northern Plains
Temperatures trend well above normal across Montana, the Dakotas and Wyoming. Precipitation runs below normal. Northern Montana and the Dakotas are particularly affected — below-normal snowfall is the dominant signal.
What it means for operations. The lightest season in this forecast. Salt and material stockpiles may carry over into spring. However, El Niño winters are not snowless winters. Isolated heavy events can still drop 8-12 inches in 24 hours even when the seasonal total runs 30-40 percent below average. Staffing decisions should account for fewer activations, not zero.
Regional Forecast: Great Lakes
The polar jet stays north and Arctic outbreaks become less frequent. Temperatures trend above normal. The real story for contractors here is lake-effect snow: when the air mass crossing Lakes Erie, Ontario, Michigan and Huron is warmer than usual, the temperature contrast that generates lake-effect snow bands diminishes. NOAA’s historical data shows significant reduction in multi-day lake-effect events during strong El Niño winters.
What it means for operations. Fewer multi-day lake-effect events — the kind that stack 24-48 hours of continuous plowing for contractors in the snowbelts from Buffalo to Marquette. Seasonal contracts may see lower costs, but per-event operators in the lake-effect corridors face thinner revenue. Anticipate more freezing rain relative to snow as the rain/snow line shifts.
Related: Impact of Climate Variability on Snow Removal Business Profitability
Regional Forecast: Northeast
Temperatures run above normal with 55-65 percent probability. Precipitation tracks near to above normal, especially along the coast. Inland areas from upstate New York through northern New England may still see heavy, wet snow in January and February from active nor’easters — the southern jet feeds coastal storms even when interior temperatures run warm.
What it means for operations. The rain/snow line will be volatile. A storm that starts as snow in Hartford or Boston may transition to rain mid-event, then refreeze overnight. Ice management becomes more important relative to snow removal. The snow that does fall will be heavier and wetter than average, increasing loader and equipment strain. Calibrate material application rates for mixed precipitation, not dry powder.
Regional Forecast: Mid-Atlantic
This is the most complex region in the forecast. Cloud cover from the active southern jet pushes temperatures to near or slightly below normal — counter to the national warming trend. Precipitation runs above normal. Snowfall is a boom-or-bust proposition: western Pennsylvania, Maryland and West Virginia lean below average, while eastern areas from Virginia through the Carolinas see enhanced storminess from the southern track.
What it means for operations. Mixed precipitation events — freezing rain, sleet and wet snow in rapid succession — will complicate operations more than in a typical winter. De-icing material demand could spike even if total snowfall runs below average. Contractors should model material budgets on event count, not seasonal snowfall totals.
Regional Forecast: Southeast
Temperatures run near to slightly below normal — one of the few regions where El Niño does not produce a warming signal. Precipitation runs well above normal; NOAA gives above-normal precipitation its highest probability here, in the range of 60-70 percent. The active southern jet stream pushes storm systems directly across the Gulf states.
In Florida, the difference is dramatic: El Niño years average 23.3 river flood events versus 4.9 in neutral years — roughly a fivefold increase. Tornado counts in the state roughly double during El Niño winters.
What it means for operations. Ice storm risk rises across the Carolinas, Tennessee and northern Georgia. Rare freezing-rain and sleet events are possible when cold air from the north interacts with the active southern jet. Crews in these areas should pre-position de-icing materials before November. Municipalities that rarely deal with ice events are the ones most likely to be caught underprepared.
Regional Forecast: Southwest and California
Cloud cover partially offsets the warming signal, keeping temperatures near normal. Precipitation runs well above normal — 120-150 percent of average is the working range. Atmospheric rivers are the primary delivery mechanism.
Snowfall runs above normal in the Sierra Nevada, the mountains of Utah, Arizona and southern Colorado. OpenSnow’s 2026-27 preview highlights this as the region with the strongest above-normal snow signal in the country.
What it means for operations. Mountain-pass and resort contractors face a strong season. Urban and valley operations below the snow line deal with flooding and rapid rain-to-snow transitions. The 1997-98 super El Niño produced roughly $550 million in flood damage across California — contractors in flood-prone corridors should factor water management into their winter plans, not just snow removal.
What Contractors Should Not Assume
A “warm winter” does not mean “no snow.” It means the snow falls in different places and different patterns than a neutral or La Niña year. Six things to keep in mind:
- Analogs are not forecasts. The 2015-16 super El Niño underperformed Southwest expectations. The 1997-98 event hammered California harder than models suggested. Historical parallels set a range of outcomes, not a single answer.
- Polar vortex disruption is possible. Early stratospheric signals from the ECMWF and UKMO show unusual weakening of stratospheric winds around late December through January. A sudden stratospheric warming event could produce cold outbreaks across the northern tier weeks after the disruption — temporarily overriding the El Niño warming signal.
- Per-event pricing in the northern tier carries more risk this year. Model a 20-40 percent reduction in plowable events in the northern tier. Seasonal contracts with fixed revenue may be safer for operators there this winter.
- Southern-tier contractors who rarely see ice events should not dismiss this forecast. An active southern jet means more mixed-precipitation events in regions where crews, equipment and municipal stockpiles are not sized for them.
- Material budgets should track event count, not seasonal snowfall. A winter with 15 percent less total snow but 30 percent more freezing-rain events will use more de-icing material, not less.
- The global temperature signal adds a complication. Climate scientists project this El Niño will add 0.2-0.3 °C of temporary warming above baseline trends, with 2026-27 likely setting global temperature records. Higher base temperatures push the rain/snow line higher and make mixed-precipitation events more frequent at elevations that normally see only snow.
What to Watch Between Now and December
The seasonal forecast sets the baseline. The decisions that matter — dispatch timing, material pre-positioning, crew scheduling — depend on shorter-range updates. Here is the calendar:
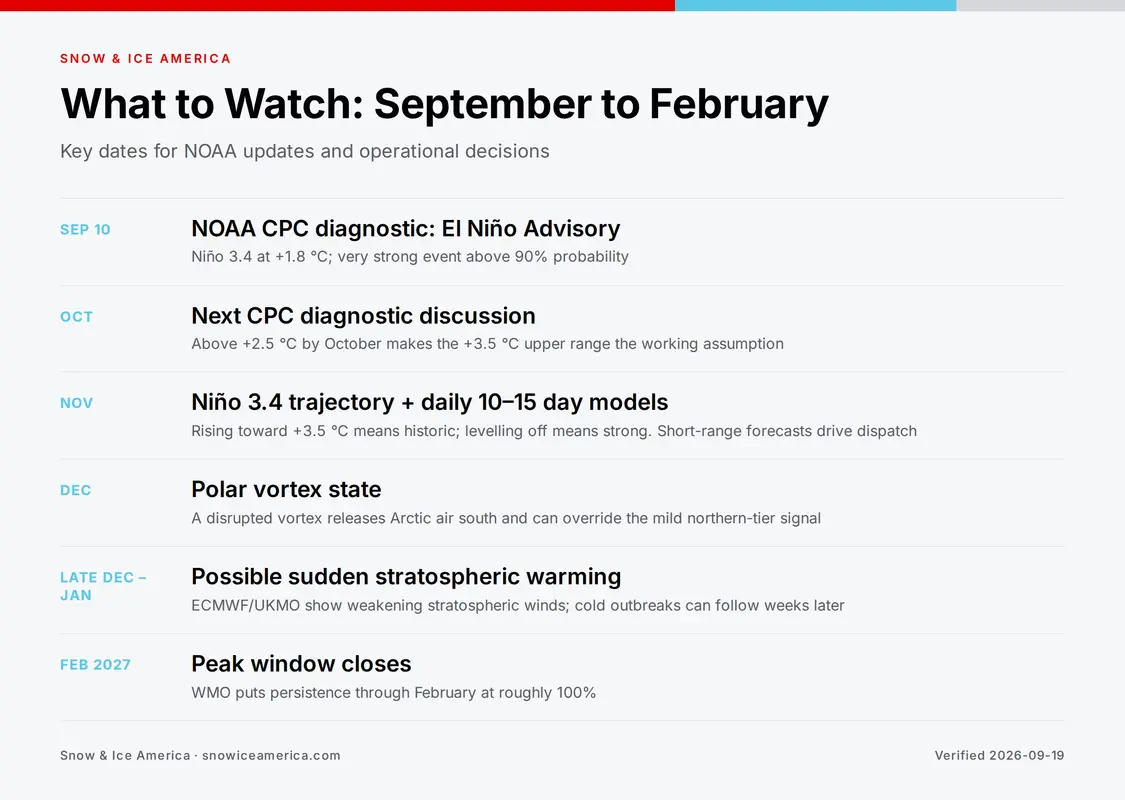
- October NOAA CPC diagnostic discussion. The next official ENSO update will narrow the strength envelope. If the Niño 3.4 index tracks above +2.5 °C by October, the upper range of model projections (+3.5 °C or higher) becomes the working assumption.
- Niño 3.4 index trajectory through November. Whether SSTs continue rising toward the +3.5 °C range or level off determines whether this is a strong event or a historic one. The distinction matters most for regions near the dividing line between above-normal and below-normal precipitation.
- Polar vortex state entering December. A strong polar vortex locks cold air in the Arctic and reinforces the mild-northern-tier signal. A disrupted vortex — which early models suggest is possible this year — releases cold air southward and can produce sudden, severe events in regions that otherwise expect a quiet winter.
- 15-day forecasts from November onward. Seasonal outlooks tell you what to plan for. Short-range forecasts tell you when to dispatch. Once November arrives, watch the 10-15 day models daily — they drive the actual operational decisions.
Allan Robinson
EditorialThe Snow & Ice America editorial team tests and reviews plows, spreaders, and fleet tools with working contractors across North America. Independent. Never sponsored.
Price your next snow job in 60 seconds.
Estimate per-push, per-inch and seasonal pricing for any lot.